2023 Q2 Mobile Traffic
Fraud vs Human, iOS vs Android, by Browser


How much mobile fraud did appear (1) during 2023Q2, (2) PAID traffic only, (3) on iOS and Android, (4) measured at the landing page(s)?
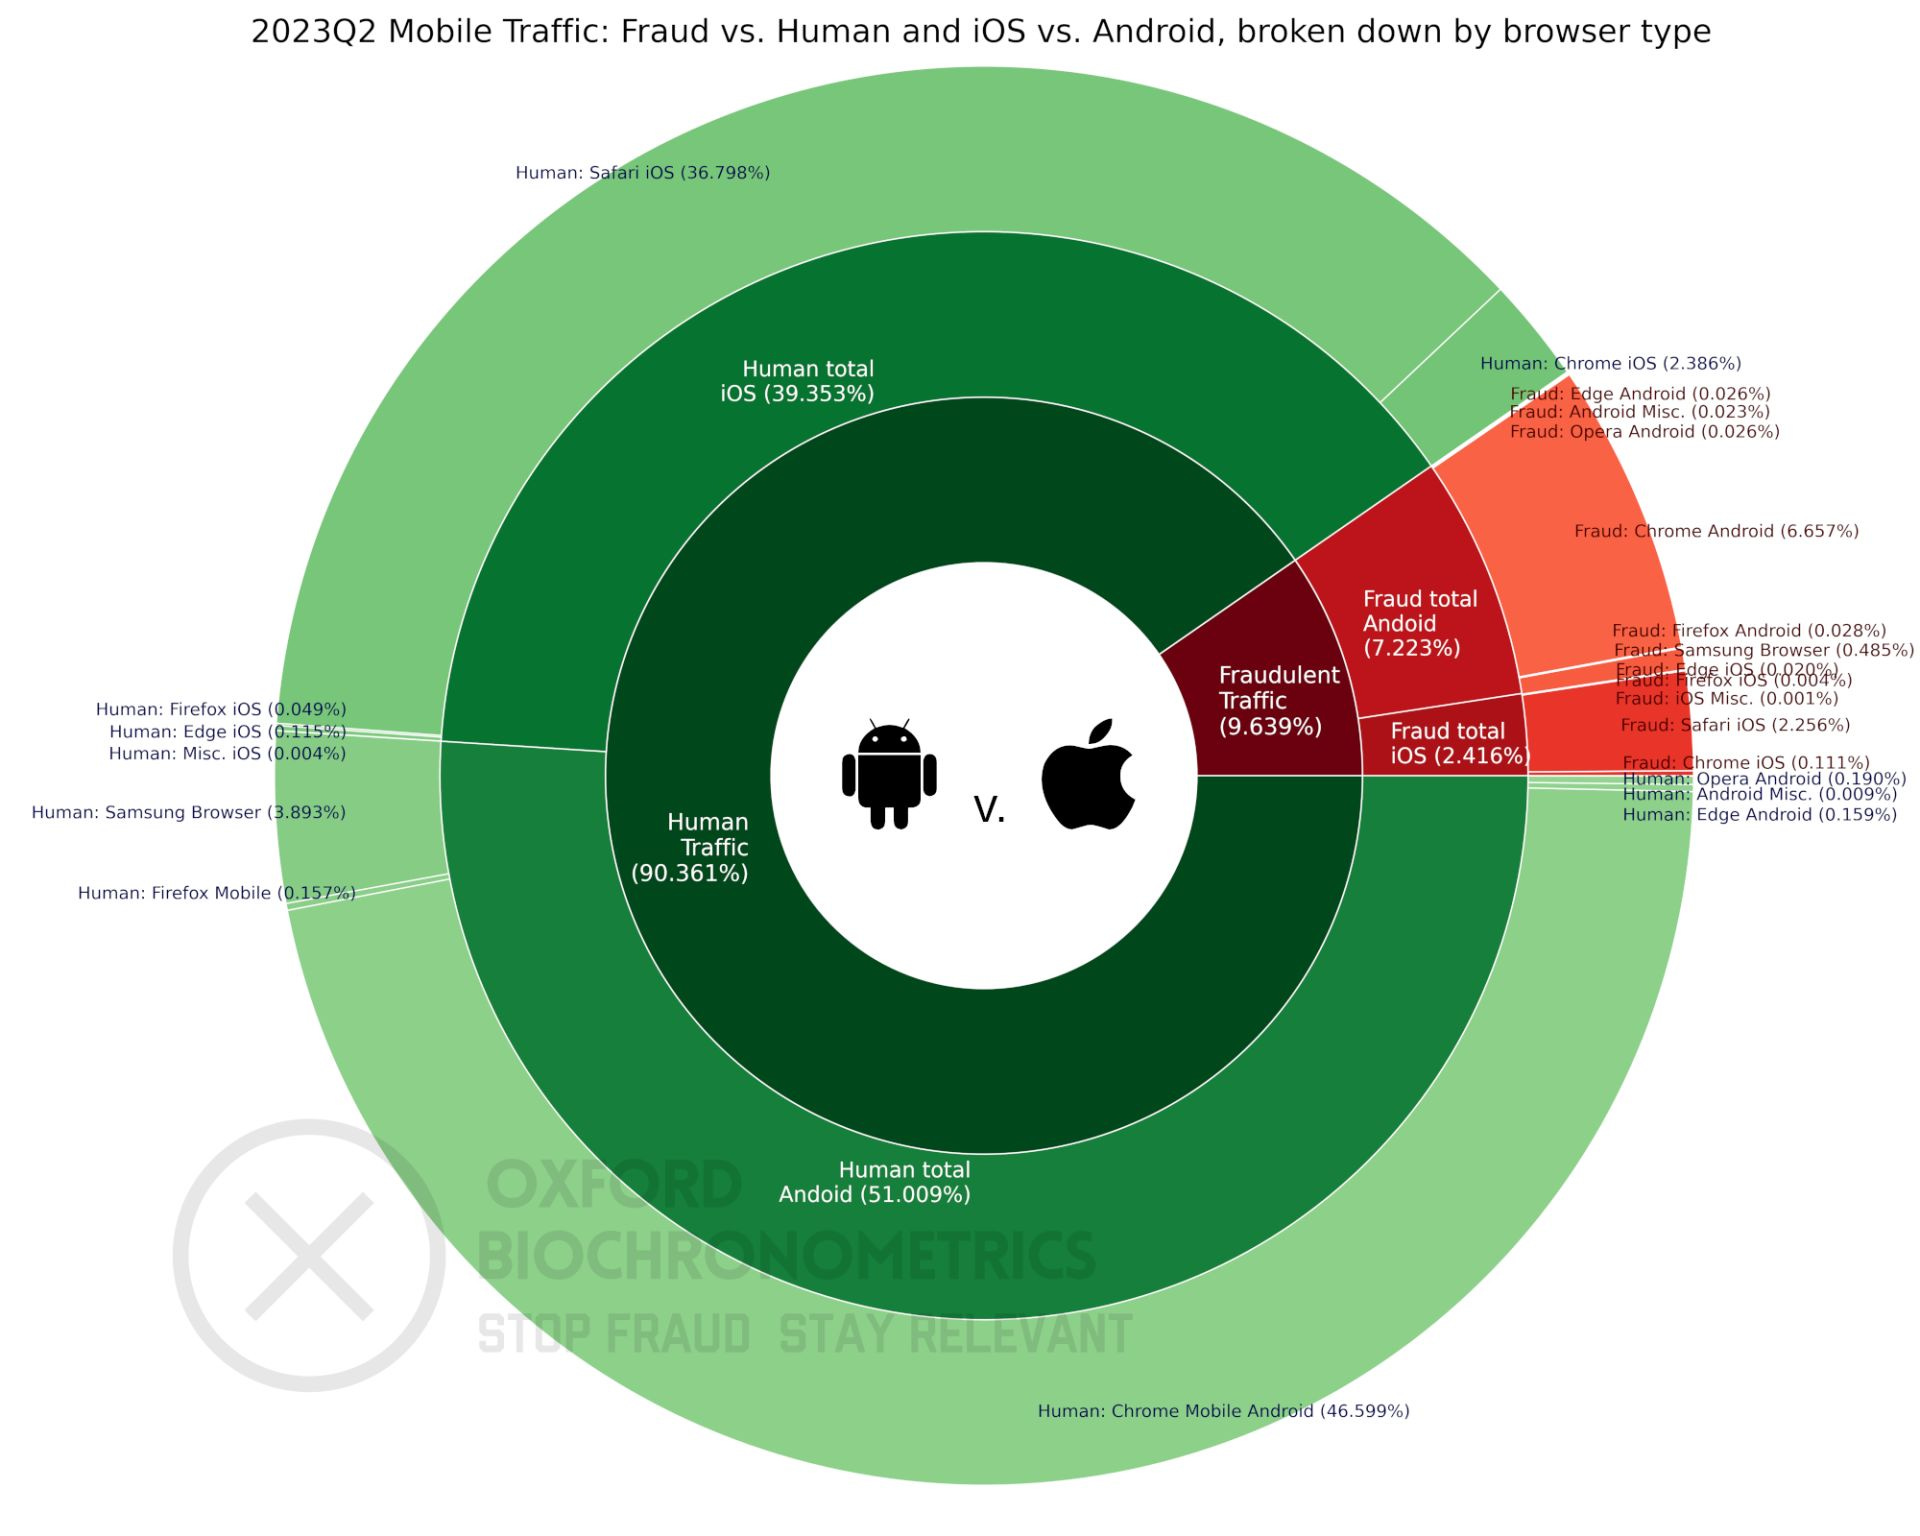
The most inner ring contains the total percentages for both fraud and human traffic. Each of these groups are broken down to iOS and Android and subsequently to the most used browsers which has been used to access a landing page. The percentages in each of the three rings will add up to 100%.
Mobile traffic in 2023Q2 had ~10% fraud, roughly 1 in 10 visitors and an increase of 2% compared to the previous quarter! It is again a completely different picture compared to desktop traffic in 2023Q2 where 1 in 4 visitors was flagged as fraud. The ratio Android / iOS in human traffic is about 60:40, the exact numbers are: Android (58.25%), iOS (41.75%). The picture changes when looking at fraudulent traffic, where the ratio is 75:25, the exact numbers are: Android (74.94%), iOS (25.06%).
This shows -just like previous quarters- that Android traffic contains more fraud than iOS. Also, nearly all iOS fraud doesn’t originate from real iOS devices. The fraud originates from Android or (special) desktop browsers pretending to be an iOS device by faking the user agent and device fingerprints.
Note: The numbers are based on traffic measured at landing pages, microsites, lead gen forms, digital sales, check-out pages using Oxford Biochronometrics ’ SecureLead.
Legend of the chart: GREEN indicates human traffic, RED indicates fraudulent traffic.