

Part 2 of Foundations of Fighting Ad-Fraud - Analytics

Ad fraud. A problem ignored by many in the digital advertising ecosystem. Why? Because they make more profit when the problem persists. They are not interested in delivering their clients quality visitors, but invoicing as much as possible is what matters.
Ad-fraud thrives in places where checks and balances cannot be made easily because of the fragmented and distributed nature of the ecosystem.
Financial ad-fraud
One form of fraud is that the reported number of placed advertisement doesn't match reality. The problem of the advertiser is that they can't check every placed advertisement. The result will be an invoice that's 20% too high. Is the advertiser able to check that the reported number and the invoice based on that number has been inflated with 20%? No! Not without detailed per line item logfiles and its analysis.
Another fraud form is: Did the placed advertisements meet the configured constraints and expectations? Like adhering the min max thresholds of bidprices? Is the advertiser able to check this? No! Not without detailed per line item logfiles and its analysis.
MFA (Made for Advertising) sites are fraudulent because they don't meet the advertiser's expectations and minimum standards. Reporting traffic generated at MFA sites as premium URLs is: fraudulent.
Ad-fraud carried out by tech
Besides these forms of inflating numbers or inflating quality which fit financial fraud there's also technical fraud. This type of fraud happens because fraudsters play the ecosystem using advanced technology. The name of this advanced technology is: Bots, or browser automation. The different technical types are described this article 'How does bot and human operated fraud work?' [1]. The previous article in this series described how these can be detected [2]. This article will continue on the previous one by analyzing at the detection results by breaking it down into many different segments.
Ad fraud detection enables advertisers to determine the good players and bad players. But, ad fraud detection on its own isn’t actionable. The output of the fraud detection needs to be broken down by domain, appname. These two are the obvious pivots and enable you to know which domain or app attracts bot traffic to cheat.
Technical fraud hides in averages
Fraud hides in averages. If you run a multimillion dollar campaign and one of your traffic sources contains a high level of fraud it is invisible when you only look at averages. The answer to this lies in analytics. Breaking down the data and using analytics enables you to find fraud patterns in the data.
Ad fraud Analytics
The first step in analytics is data exploration. You know fraud hides somewhere, but you don’t know where because the fraud is hidden in averages. Breaking down the data into segments (source, campaign, country, publisher, ISP, etc) enables you to see which one contains more fraud than others. The only problem with this method is: It takes a lot of time to find the exact segment and the value that contains the fraud.
Analytics: Treeview Examples
Since you don’t know upfront where fraud appears and what its common denominator is you need to start looking at the big picture where you can see all data at once. An efficient way to efficiently look at all data and its fraud is to show the data as a treeview. The treeview shows all data, but broken down to a segment of choice. Each segment is again broken down to human/fraud showing which segment has almost no fraud or a lot of fraud. For example, Figure 1 shows all traffic arriving at a landing page. The visits are broken down to the traffic sources (anonymized in the figure below). Each source has a different fraud level and this single treeview shows them all, sized relative to each other. Human visits are blue and fraudulent visits are toned red. The difference between the red tones is where the fraud has been detected at the request (dark red is request based fraud) or using JavaScript (lighter red).
. Each with a different amount of traffic and a different level of fraud.")
Figure 1 shows that the three largest paid sources have 11.4%, 12.1% and 9.6% fraud. But it also shows that smaller sources have 37%, 54% and more than 70% fraud. Looking only at the total average would have made these smalles ones invisible as the 3 largest paid sources dont have much fraud and represent ~35% of the total paid volume.

Breaking down the data into states shows where your audience physically resides. This should match your targeting. It also shows where fraud enters the Internet. In Figure 2 can be seen that the state with the largest fraud% is California. This doesn’t tell you much on its own, so we’ll zoom in to the city level.

Figure 3 shows in the right lower corner that Mountain View (CA) has 90+% fraud and represents ~1/3rd of the total fraud in CA. Although this is good information, city as a pivot has some disadvantages: There are too many small cities (the long tail of cities) and as you can see in Figure 3 the left side of the chart isn’t readable in the overview. Although you can zoom and labels will become visible, it is just too much.
Back to Mountain View (CA). Why does it have so much fraud? It’s because a Google Data Center is located over there. This confirms that data center traffic equals bot traffic, which makes perfectly sense. Who lives and browses the Internet from a data center legitimately? Maybe those 2 or 3 individual working in the operations room? Anything else would be VPN traffic, proxy servers, and bots running in those data centers.
To see how fraud is distributed over different ISPs, let’s take a look at Figure 4. This animated GIF zooms in to both Google and Amazon data centers. You can clearly see that almost all traffic from these IP ranges is fraud. Blocking data center IP ranges in you ad infrastructure is a good and cheap way of preventing bots to bid and load your advertisement. Once data centers are excluded bots need to use residential proxies at an extra cost, it adds complexity, the proxies might be detected as fraudulent, and thus affecting their profit margin.

But, what about other added value of breaking down human/ fraud per location or ISP? You could see whether your intended geo-targetting is correct, and you pay for visitors from other countries, or states or even cities. If you target desktop, you don't expect mobile gateways to be used. Secondly, you would be able to see whether fraud originates from a single location outside data centers or new IP ranges recently bought by a data center.

In Figure 5 the same traffic is broken down into appname (Android). The two largest apps in volume don’t have that much fraud, although it would be interesting to see why their percentages differ so much (7.8% newsbreak vs 14.3% facebook).
But, take a look at some of the smaller apps. Those apps have more than 50% fraud, some even 75%. These are the typical apps you want to take a look at and ask yourself: Do I really want to pay for this? Does thise apps really bring new business? Also take a look at that long tail of apps, the left part of the image with all those small rectangles. Although they don’t bring that much traffic, some of those are 100% fraud. Those are the typical ‘non-existing’ apps, with fake app names. Together this long tail of apps ( < 0.5% per App) generates 8.3% of the volume, with ~14% fraud. And, yes, this is data from a client that has been continuously optimizing their traffic quality.
Analytics: Time series examples
The treeview is an excellent way to get a quick overview of what happens, but doesn’t show you the time component of a campaign. You know when you start a campaign, which channel you use, what you have whitelisted (domains and apps) and/or blacklisted (data center Ips), etc. You also know when changes were made and you want to see the effects of those changes as time progresses.
The charts below have the same colorcoding as the previous figures, and they are based on the same data, except the time range. Each bar represent a full day, which smooths things out and shows the bigger trend only.
 goes down. Red = fraud, Blue = human. Client and source are both anonymized.")
Figure 1 shows the aggregated results for all sources including the two sources in Figure 6. What can’t be seen in figure 1 is how things progress over time and behave at different volumes. The bottom chart in Figure 6 shows that this source miraculously has 40% fraud at any volume. To me this looks like a configured percentage or lever which sets the percentage of cheap (bot)traffic mixed with real traffic.
The treeview containing the US states showed that California did have a lot of fraud. How does this look when plotting the data as a time series in a chart. Figure 7 shows the Californian traffic. It shows that when the volume goes down the fraud% temporarily goes up.

In Figure 2 the treeview of the states shows that California has a high percentage of fraud, compared to its peers having the same traffic volume. Florida another state with a big volume has a much lower fraud percentage, see Figure 8. So, how do these two compare? Again you can clearly see that the volume decreases around the same date. This time the fraud temporarily goes up a tiny bit, but then goes down to a low level without spikes or other high fraud days. Looking at other states will reveal that states with huge (relatively cheap) data centers were responsible for this temporary increase.

Finally, we’ll take a look at how traffic from Android apps looks like. Figure 5 shows a treeview where you can compare all Android apps to each other, both in volume and in fraud levels per app. But, how does an app look when looking at fraud levels over time in a timeseries. This can be seen in Figure 9, Figure 10, and Figure 11.


Let’s compare the results of the four apps above in the figures 9, 10 and 11. Looking at Figure 5 you can see the relative sizes per app. Newsbreak is the largest one in traffic size per app. Newsbreak is the largest one in traffic size com.particlenews.newsbreak. Second is Facebook’s com.facebook.katana. Other Meta/ Facebook apps are com.facebook.lite and com.facebook.orca which are ranked separately in the treeview. Third place in size is Instagram’s app com.instagram.android. An app with a high percentage of fraud is: com.instabridge.android.
The first three are well known apps, but the fourth one instabridge isn’t something normal users know, at least I didn't know it and I checked it with some colleagues and friends. So, let’s zoom in what this app really is. Figure 12 shows the apps’ information in the app store, the yellow highligted line below says it all: “The Wifi Hunt is over! Fast and Secure Public WiFi Map at no charge”. Perfect for fraudsters needing a temporary new IP address to commit fraud as long as it works. And.. free of charge! OK, apparently some ads do appear otherwise where does this app traffic come from?

Fraudsters love “free” and they even love it more if it is a shared IP address which means also legitimate traffic will originate from the same IP address and/or range. Also, WiFi with a direct connection is faster with a lower latency than using the mobile network or residential proxy servers or a combination. The devices with shady (free) VPN apps that also work as VPN endpoints using these WiFi points will help fraudsters as well. And once it doesn’t work anymore you just move on. Exactly the ingredients fraudsters love.
Let’s take a look again at the bottom chart in Figure 11 which has ~75% fraud. This app, and all other free VPN, free internet connection sharing, and apps with a hidden builtin VPN or proxies without the user knowing are prone to high levels of fraud. The first question you should ask: Does my intended audience use this app? That means the typical users of these apps are freeloaders and only install apps to save some pennies. If you’re Temu, Shein or Aliexpress, then I agree this is your audience! But, if you’re targetting people to sell car insurance, luxury vacations, hearing aids, designer bags, high-quality make-up, skincare and fragrance or just even brand awareness of these products then also agree that the remaining ~25% humans using this app won't fit your ideal customer profile.
Blacklisting these apps might be your first thought, but it takes a week or maybe a month, and they just reappear using a different name. That’s why whitelisting is so much better. Only allow your ads to be shown in the apps you selected. But, do you fear you're missing new apps? Run an A/B test with a small portion of your volume without any black or white lists and see how apps, domains, data centers, etc. perform. If they perform well you can scale up and monitor whether they continue to perform. Rinse and repeat.
Quality of ad-fraud detection is key

One of the key factors to be successful in continuous optimizing your ad spend, campaigns, budget allocation, etc. is the quality of the ad-fraud detection. It doesn’t matter how great or sophisticated the analytics is. GIGO (garbage in = garbage out) will ruin your results. Flagging humans as fraud will cost you business, missing real fraud also hurts your business. And making the wrong decisions based on faulty input is killing your business!
The collected data is not directly related to browser automation
The collected data can easily be spoofed at the client side
The communication from browser to the back-end is not well protected
When that’s the case, and that’s way more often than you might think, can you really trust the collected data? And subsequently the fraud detection engine processing this “faked” data? And subsequently trust the analytics breaking down human/fraud data and displaying It in fancy garbage charts? If there’s a lot of money involved (potentially millions to billions) which can easy be siphoned by fraudsters they will don’t easily give up and continue to hire experts in making bots and other fraud schemes. Your detection company needs to counter that with expertise in the fields of making bots, cyber-security, reverse engineering, analytics. This means fraud detection ideally is: a company with security experts providing a service in the marketing ecosystem, and not the other way around. Because the latter scenario is something we all know as: enshittification [3].
Conclusion
Fraud hides in averages. In order to identify fraud you'll need to look at the fraud detection data from various angles and/or by slicing the data into logical groups. This can be achieved using: analytics. This article has shown how analytics can be applied to reveal fraud, using real data with many examples. Looking at those charts and subcharts enabled you to see that some domains/ apps/ utm_sources/ etc were cheating and some others performed better than average.
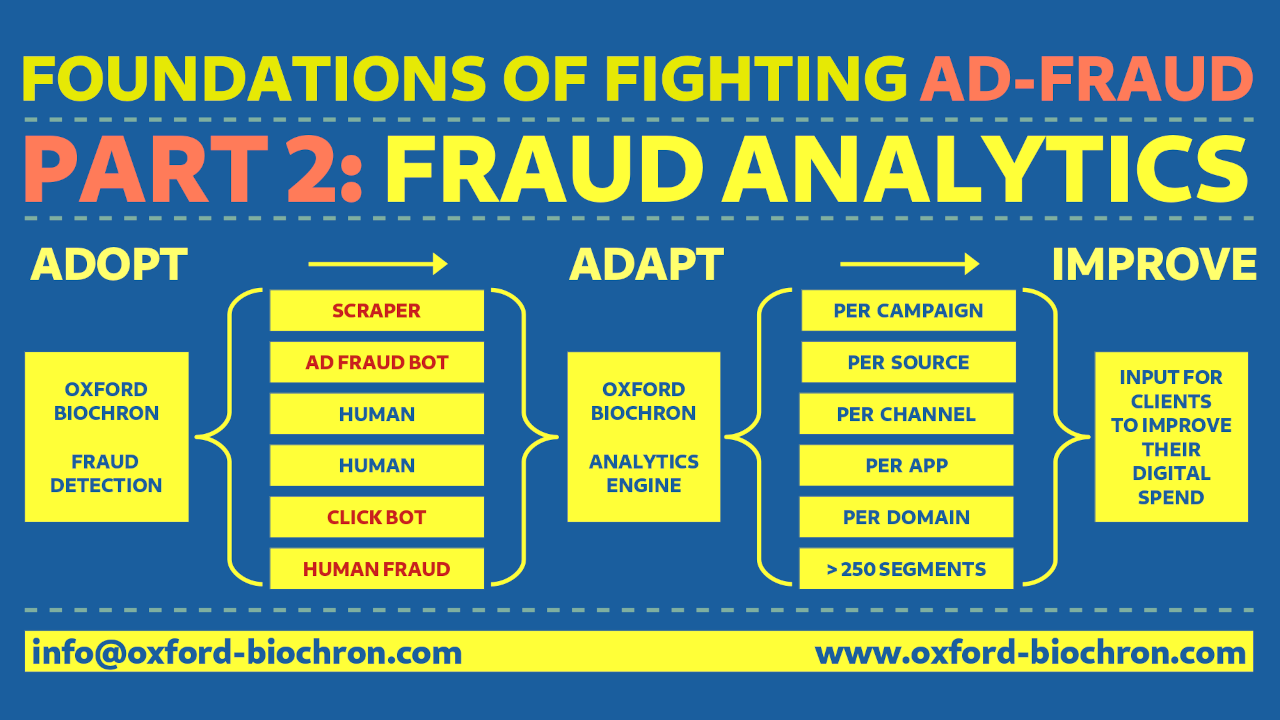
Adopt: Use quality ad-fraud detection. Hint: Oxford Biochronometrics
Adapt: Adapt your digital spend according the outcome of the ad-fraud analytics
Improve: Over time improve your results by readapting whenever possible
Feel free to contact me if you’re having doubts about the quality of your current fraud detection vendor and want to run a side-by-side test to compare results.
Corrections? Suggestions? Questions? Feel free to connect, comment or DM
#adfraud #bots #CMO #digitalmarketing #browserautomation #clickfraud #analytics #CFO #CRO
[2] https://www.linkedin.com/posts/kouwenhovensander_adfraud-bots-cmo-activity-7245048677835186178-c6vk
[4] Adopt, adapt and improve as speeched by Prince of Wales - Britain's best 'Ambassador of Trade' - at British Industries' Fair. :